InferCare Series

InferCare RECIST

Efficient longitudinal tumor assessment powered by AI-driven lesion tracking, measurement, and RECIST evaluation

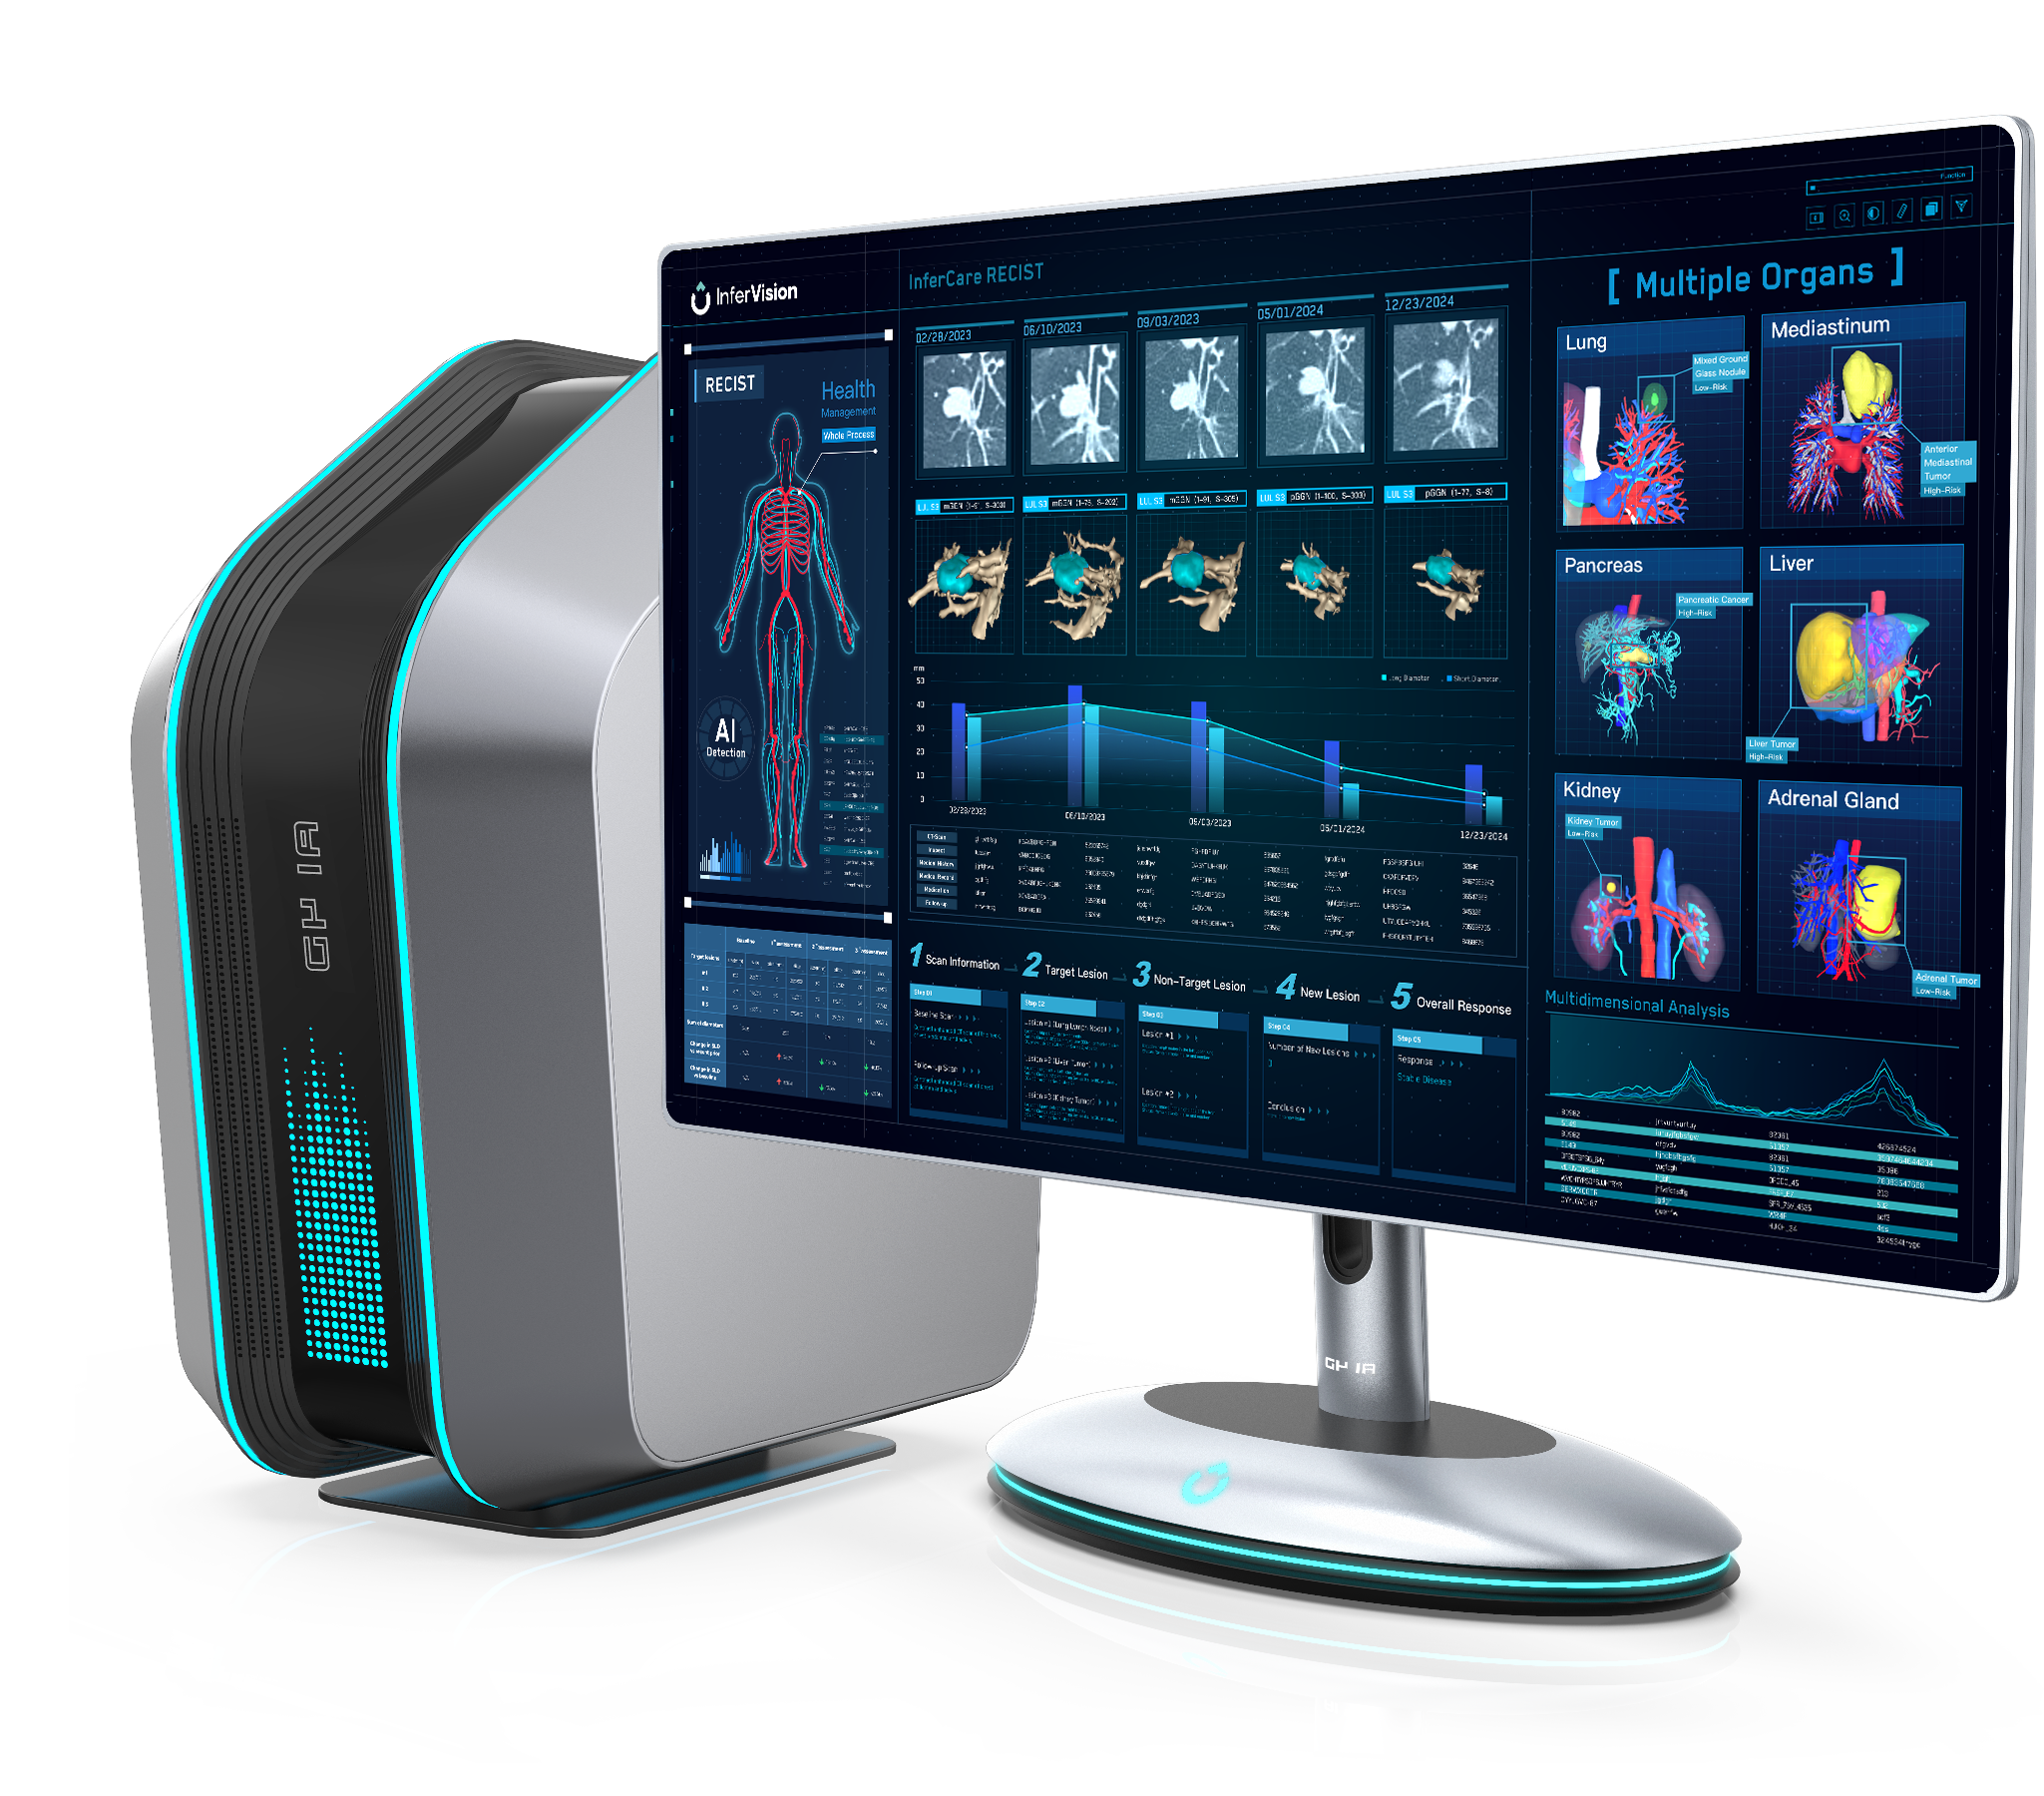
InferCare RECIST is an AI-powered medical imaging solution that helps oncology teams efficiently analyze imaging over time. It is built to assist radiologists and oncologists in tracking tumor progression and response to treatment consistently and efficiently.

Dr. John Simon

Founder & CEO of SimonMed Imaging, an Infervision partner

"Tracking tumor changes over time is an important part of understanding how a patient is responding to treatment. Tools such as InferCare RECIST can help physicians use AI to track and measure lesions across multiple CT studies, providing a more consistent view of disease progression and treatment response throughout the course of care."
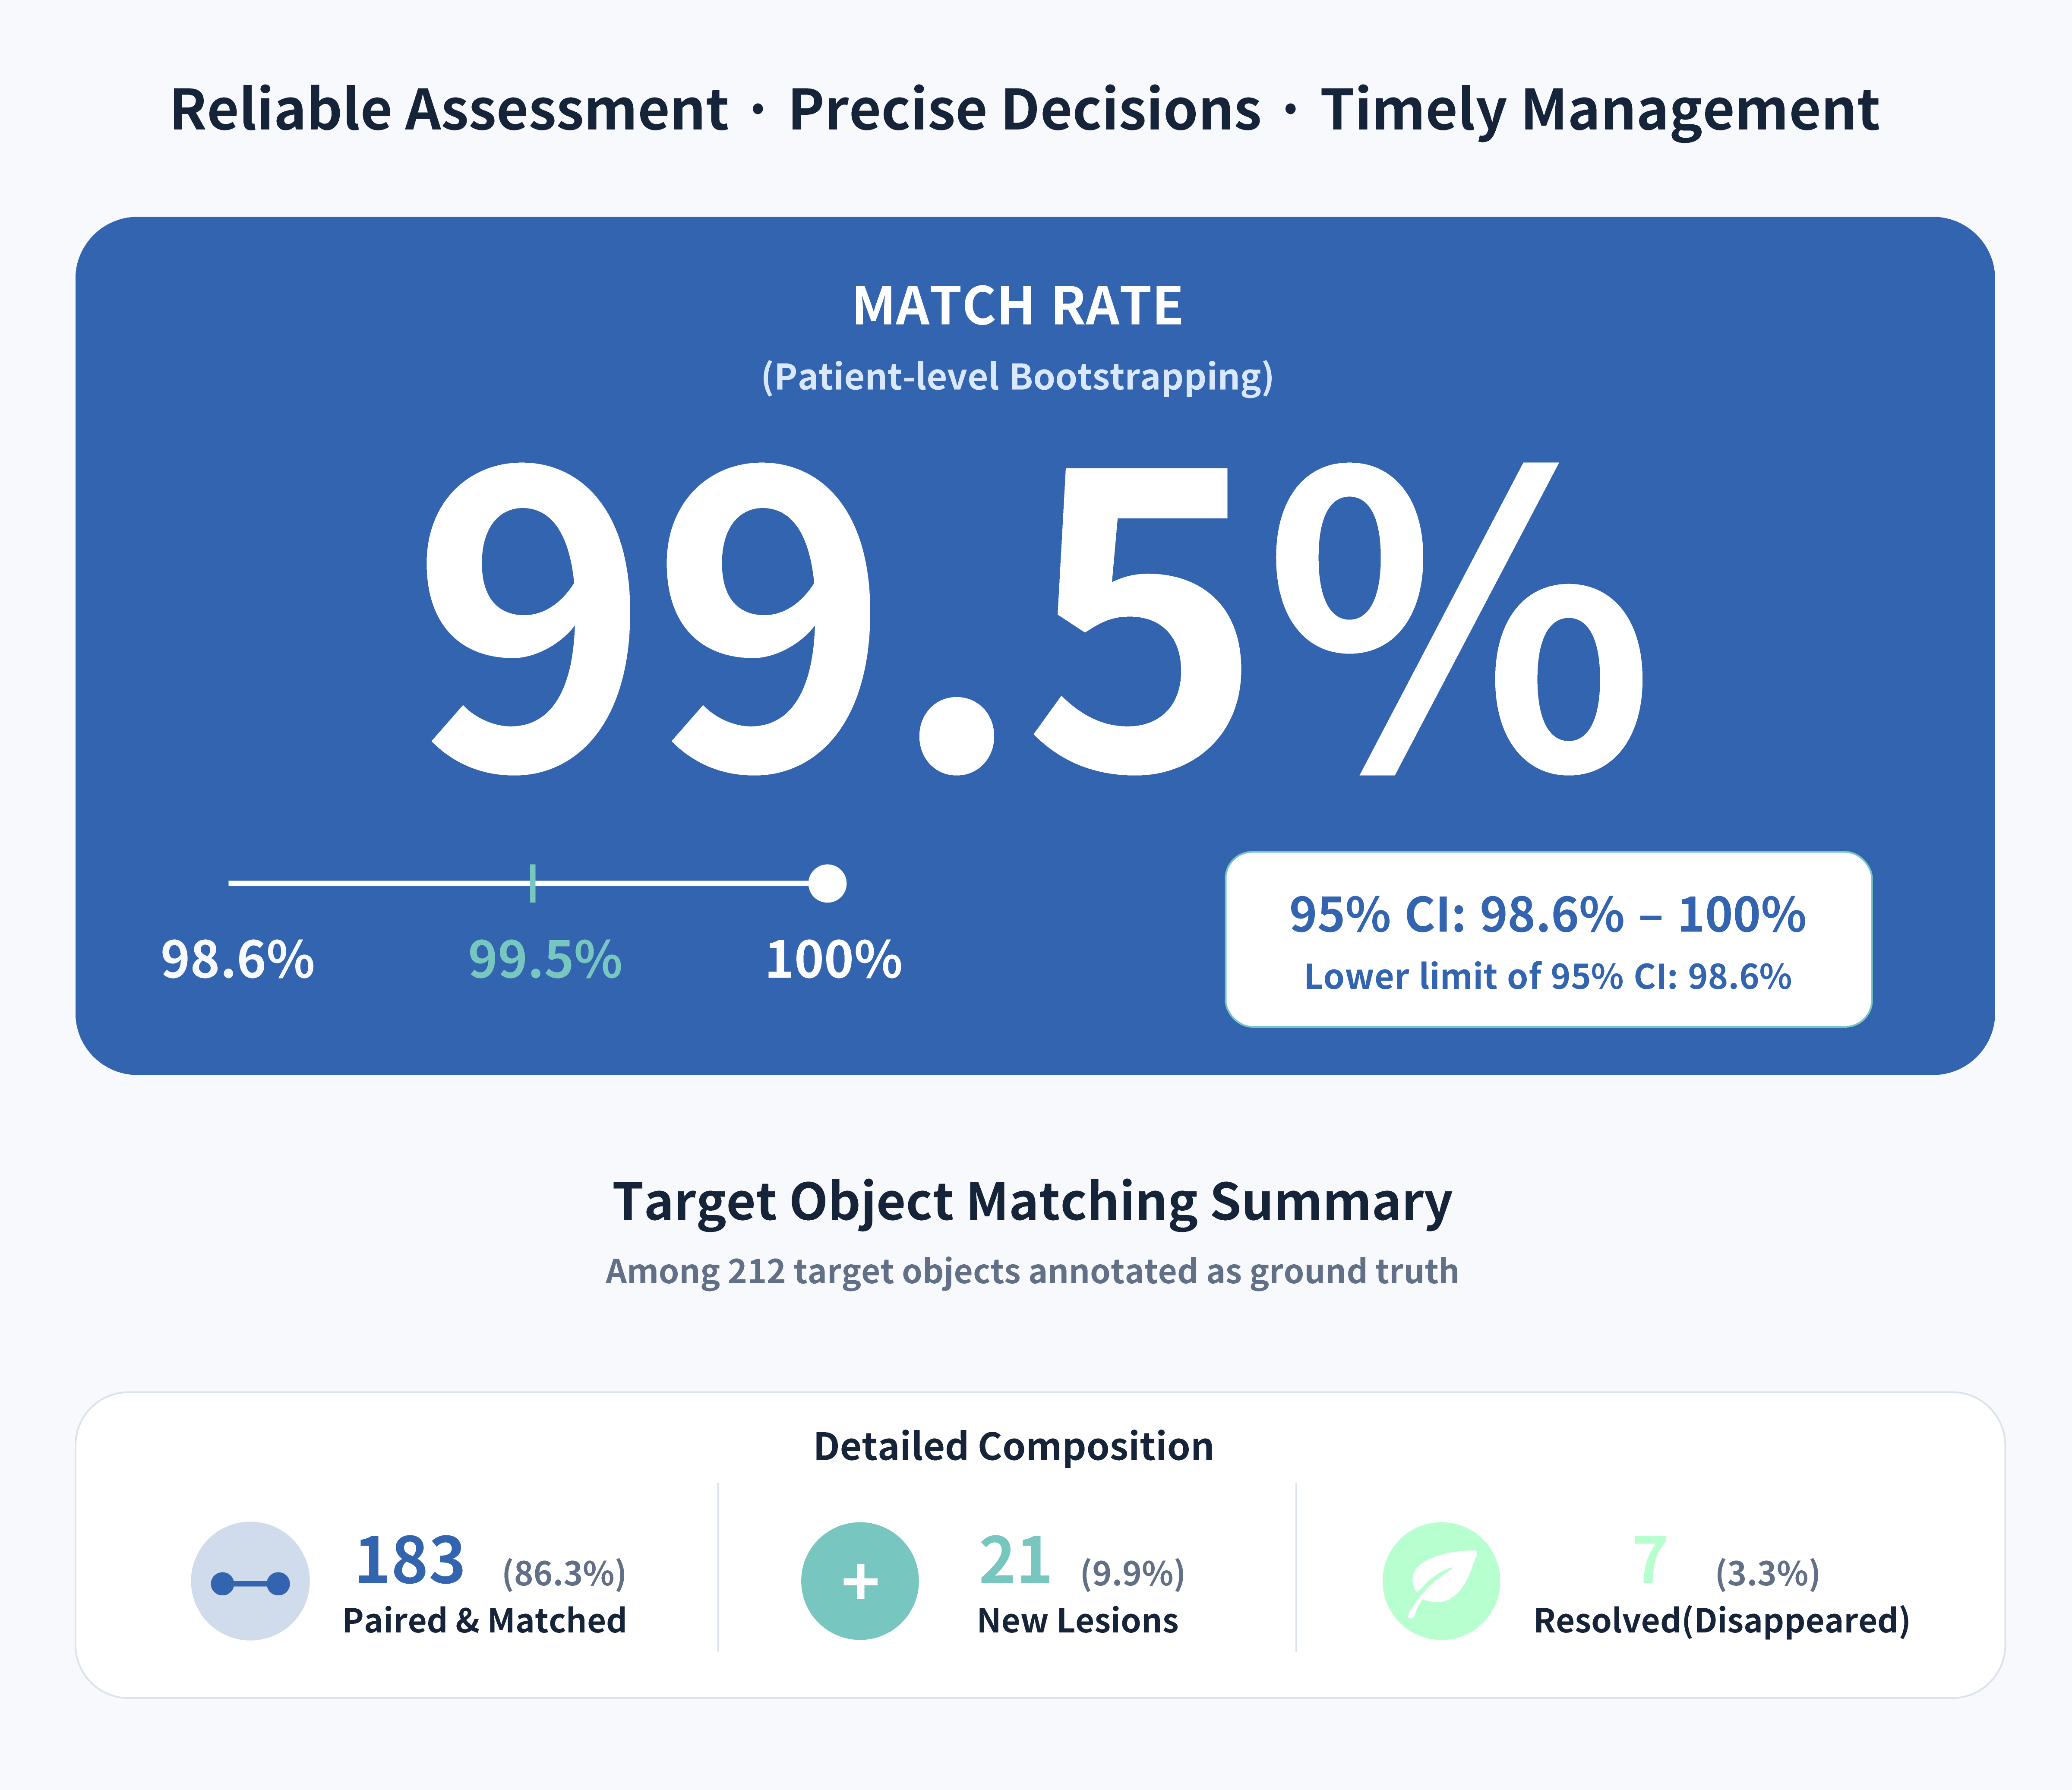

Target Matching Performance

Source: Performance validation data submitted to the U.S. FDA as part of the 510(k) premarket notification.

The InferCare RECIST Advantage

Faster Multidimensional Analysis
AI-powered multidimensional lesion analysis enables clinicians to assess tumor changes from multiple perspectives—such as diameter and volume—for a more comprehensive evaluation.
Easier Longitudinal Tracking
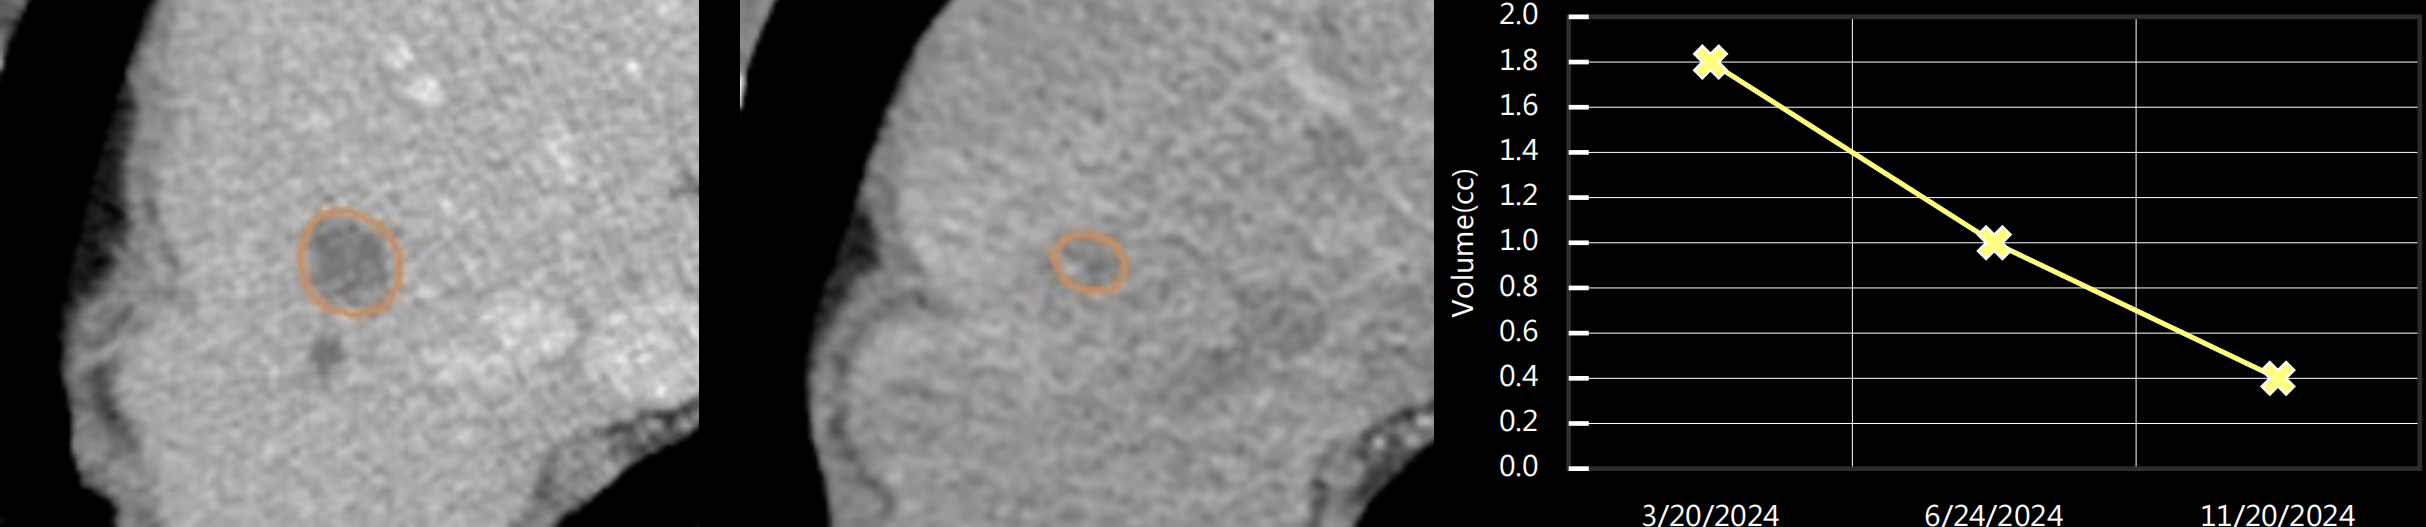
Automated, AI-powered lesion comparison across multiple timepoints clearly visualizes disease progression and treatment response.
Structured Insights, Informed Decisions
InferCare RECIST generates reproducible, image-rich response assessments with automated lesion tracking and structured reports, helping oncologists make confident, data-driven decisions.
Better Patient Care
Seamless integration with hospital information systems via standard DICOM interface, enabling structured and systematic management of oncology data across the continuum of care.

Automated Longitudinal Tracking

Step 1: When a patient undergoes a follow‑up scan, the current and prior studies are automatically sent to InferCare RECIST for analysis. 
Step 2: InferCare RECIST performs automated lesion detection, segmentation, and measurement, ensuring consistent and reproducible quantification across studies. 
Step 3: The system automatically co‑registers each lesion across all available scans for the patient. Compared with the traditional workflow—where radiologists must open multiple studies side‑by‑side, locate the same lesion, and repeat measurements—InferCare RECIST significantly reduces the workload and time required for RECIST 1.1 evaluation.
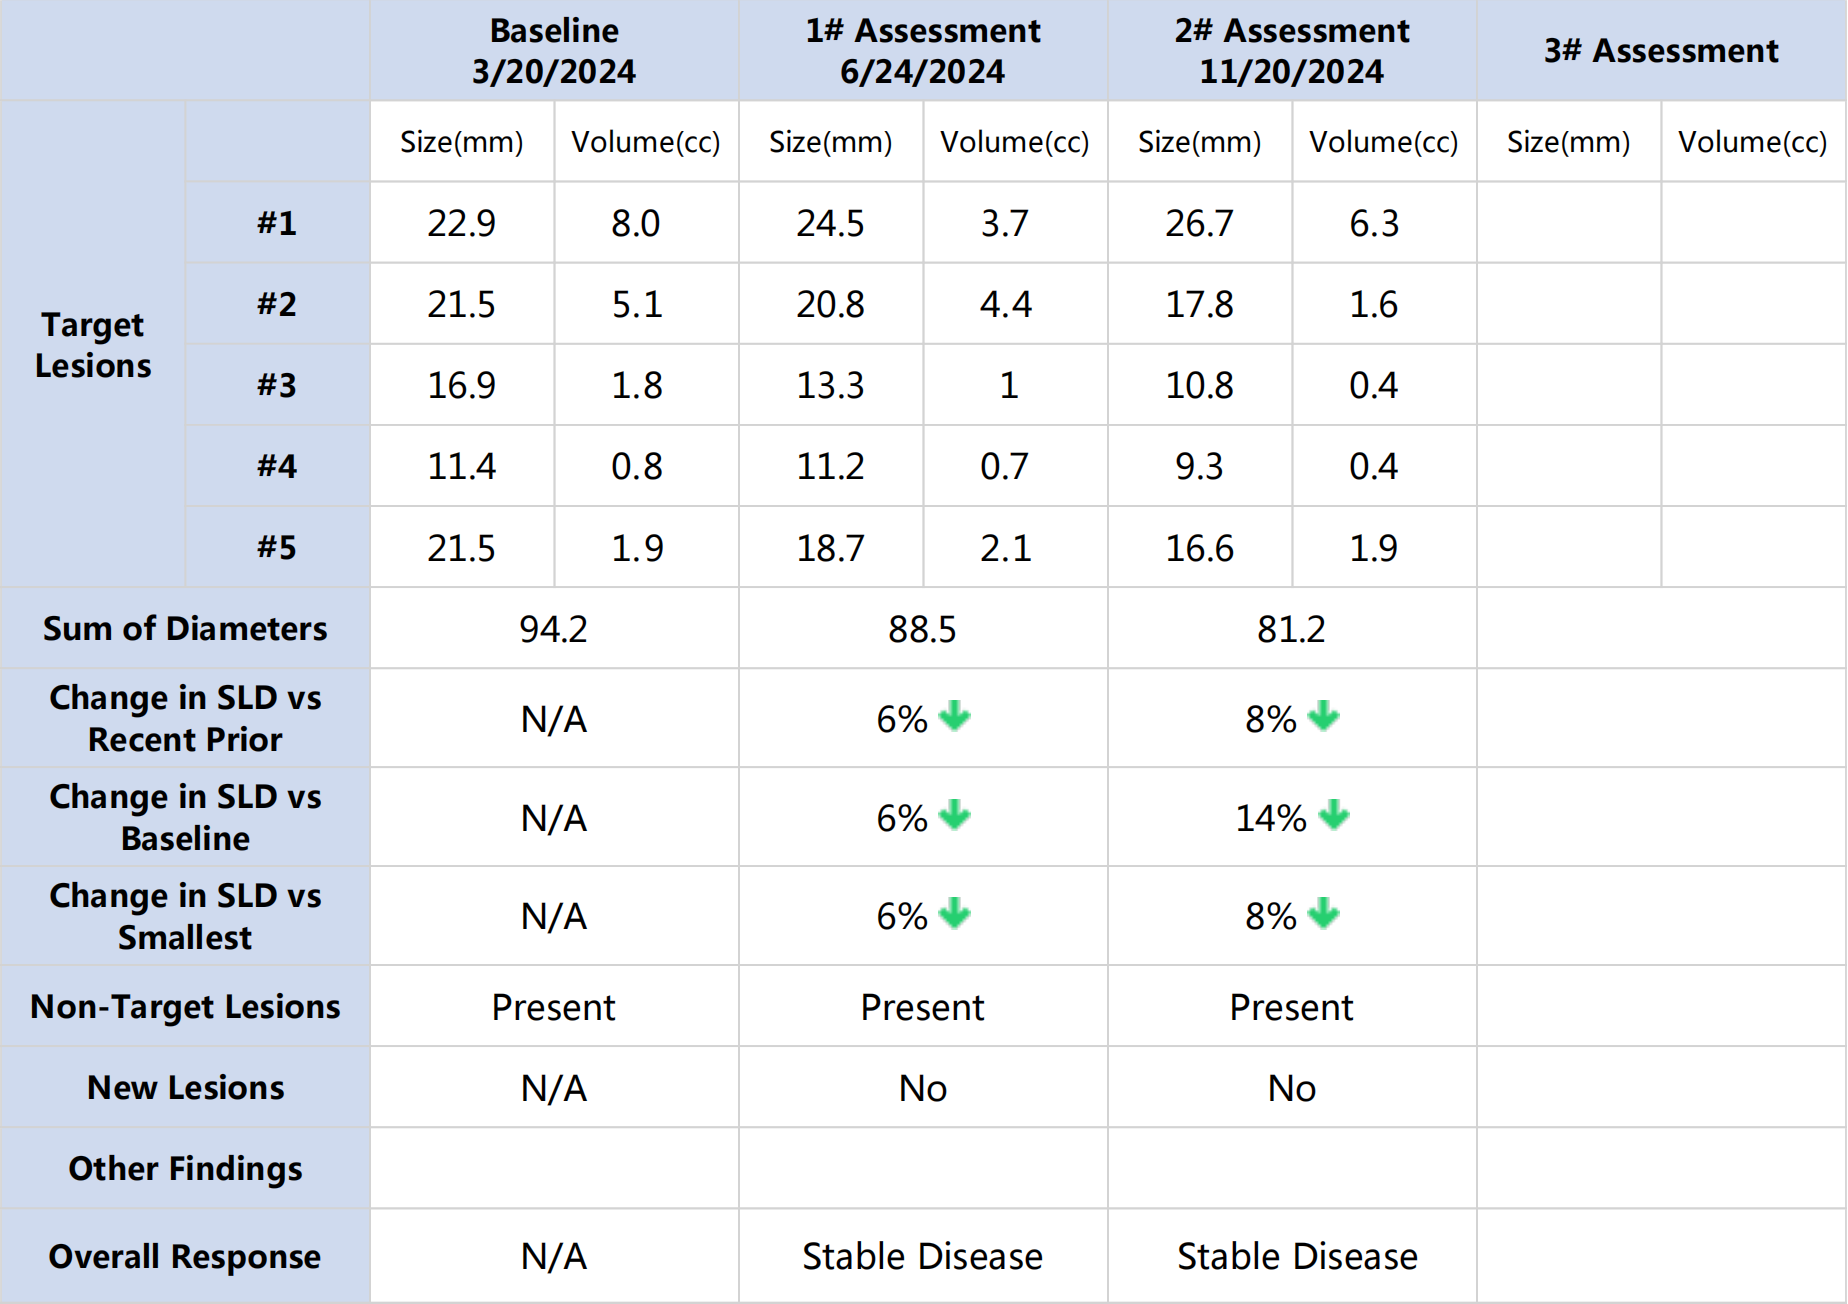
Step 4: InferCare RECIST then generates a structured report that includes selected target lesions, non‑target lesions, and any newly identified lesions, along with the corresponding RECIST response category.

Automated Longitudinal Tracking

Step 1

When a patient undergoes a follow-up scan, the current and prior studies are automatically sent to InferCare RECIST for analysis.

Step 2

InferCare RECIST performs interactive lesion detection, followed by automated segmentation, measurement, and registration, ensuring consistent and reproducible quantification across studies.

Step 3

The system automatically co-registers each lesion across all available scans for the patient. Compared with the traditional workflow—where radiologists must open multiple studies side-by-side, locate the same lesion, and repeat measurements—InferCare RECIST significantly reduces the workload and time required for RECIST 1.1 evaluation.

Step 4

InferCare RECIST then generates a structured report that includes selected target lesions, non-target lesions, and any newly identified lesions, along with the corresponding RECIST response category.
Clinical Values

Radiologists
Streamlined workflow to save time and minimize variability in lesion reporting.
Oncologists
Clear and consistent tracking of treatment response over time to support informed clinical decision-making.
Surgeons
Close monitoring of neoadjuvant treatment response to identify windows for curative surgery.

Structured Reporting

Target  Lesion: Liver Tumor
Baseline: 16.9 x 14.8 mm, volume 1.8 cc (series 9 image 44);
Follow-up: 10.8 x 8.0 mm, volume 0.4 cc, (series 5 image 55).
Target  Lesion: Kidney Tumor
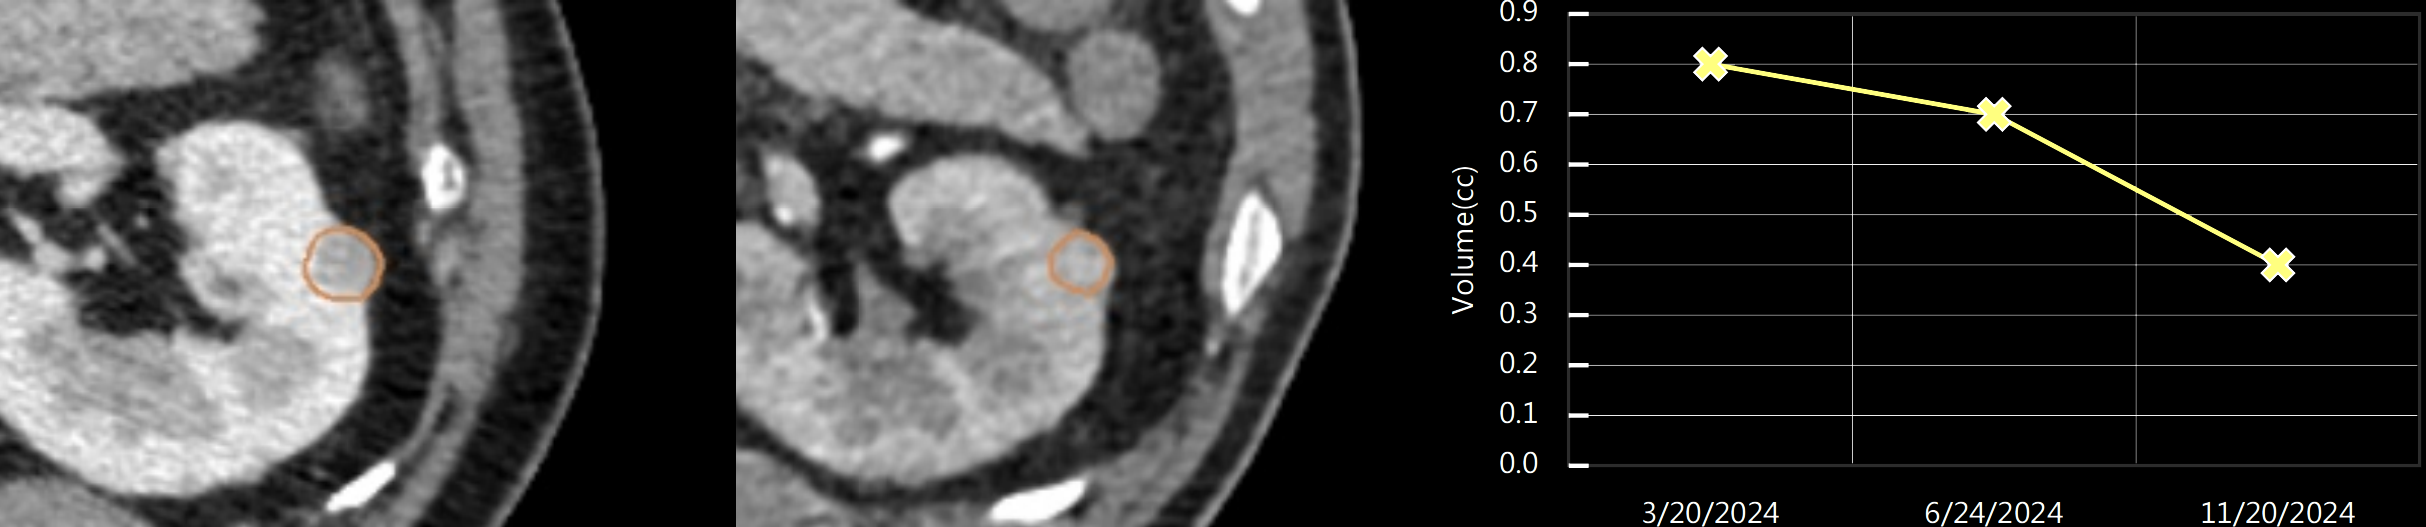
Baseline: 11.4 x 11.0 mm, volume 0.8 cc (series 9 image 103);
Follow-up: 9.3 x 8.6 mm, volume 0.4 cc, (series 5 image 95).
Newsroom

Latest Customer Stories

Get Started with Our Solutions Today

Schedule a live demo and try our solutions